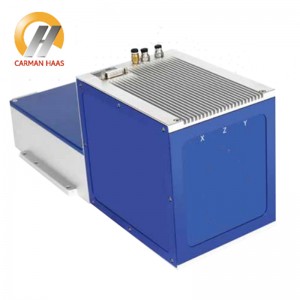
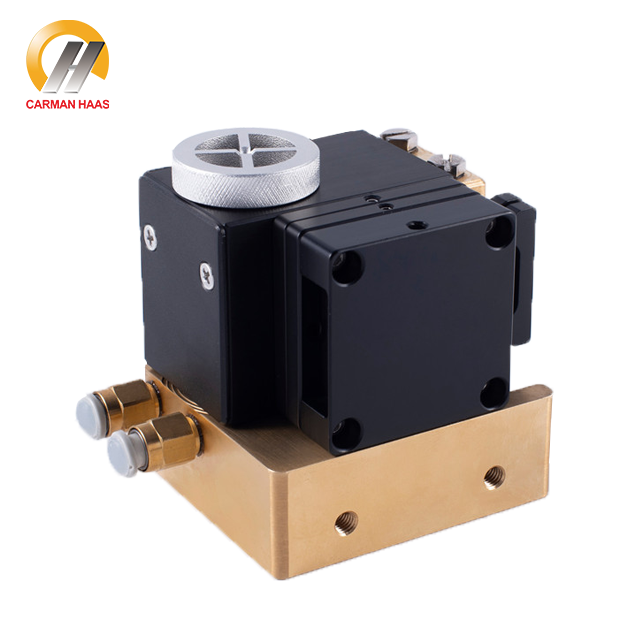

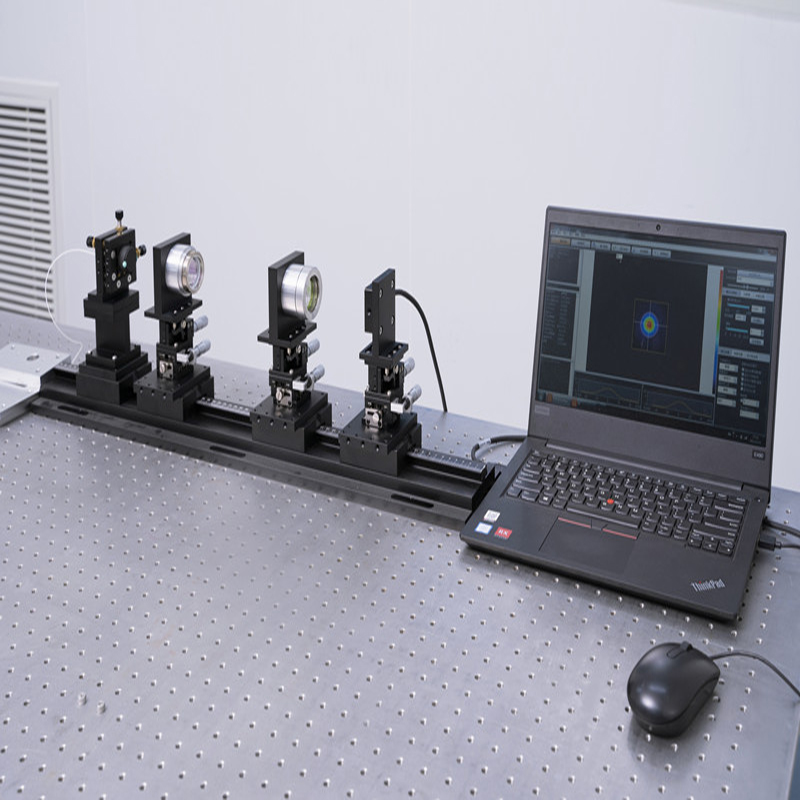
A measurement analyzer for analyzing and measuring optical parameters of beams and focused spots. It consists of an optical pointing unit, an optical attenuation unit, a heat treatment unit and an optical imaging unit. It is also equipped with software analysis capabilities and provides test reports.
(1) Dynamic analysis of various indicators (energy distribution, peak power, ellipticity, M2, spot size) within the depth of focus range;
(2) Wide wavelength response range from UV to IR (190nm-1550nm);
(3) Multi-spot, quantitative, easy to operate;
(4) High damage threshold to 500W average power;
(5) Ultra high resolution up to 2.2um.
For single-beam or multi-beam and beam focusing parameter measurement.
|
Model |
FSA500 |
|
Wavelength(nm) |
300-1100 |
|
NA |
≤0.13 |
|
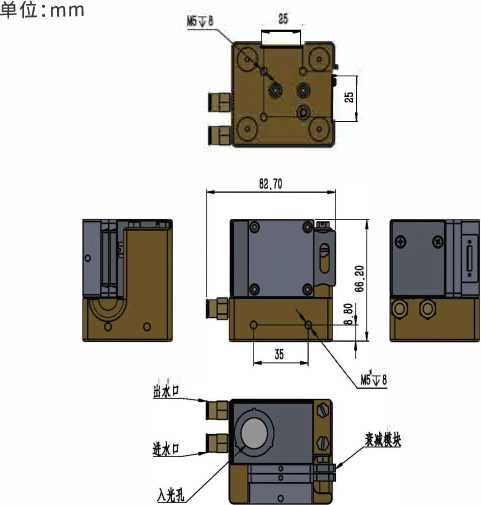
Entrance pupil position spot diameter(mm) |
≤17 |
|
Average Power (W) |
1-500 |
|
Photosensitive size(mm) |
5.7x4.3 |
|
Measurable spot diameter(mm) |
0.02-4.3 |
|
Frame rate(fps) |
14 |
|
Connector |
USB 3.0 |
The wavelength range of the testable beam is 300-1100nm, the average beam power range is 1-500W, and the diameter of the focused spot to be measured ranges from a minimum of 20μm to 4.3 mm.
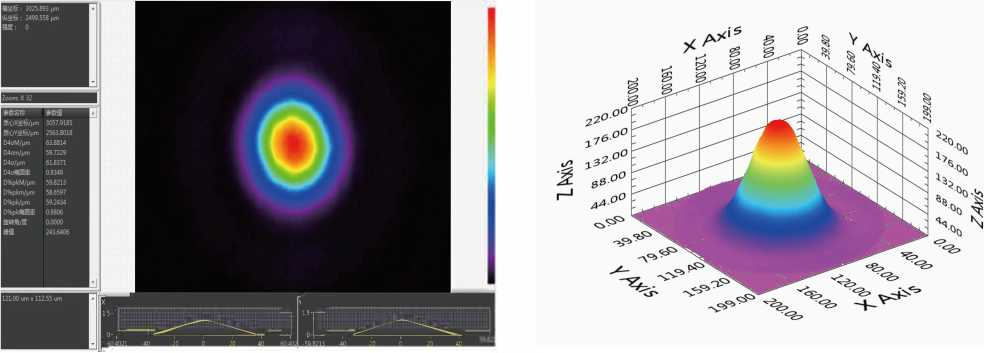
During use, the user moves the module or light source to find the best test position, and then uses the system's built-in software for data measurement and analysis. The software can display the two-dimensional or three-dimensional intensity distribution fitting diagram of the cross section of the light spot, and can also display quantitative data such as the size, ellipticity, relative position, and intensity of the light spot in the two-dimensional direction. At the same time, the beam M2 can be measured manually.